
Run Chart — Plot It, Then Read It
A measure over time, with the median line: the only way to tell improvement from noise. The grid and the four rules
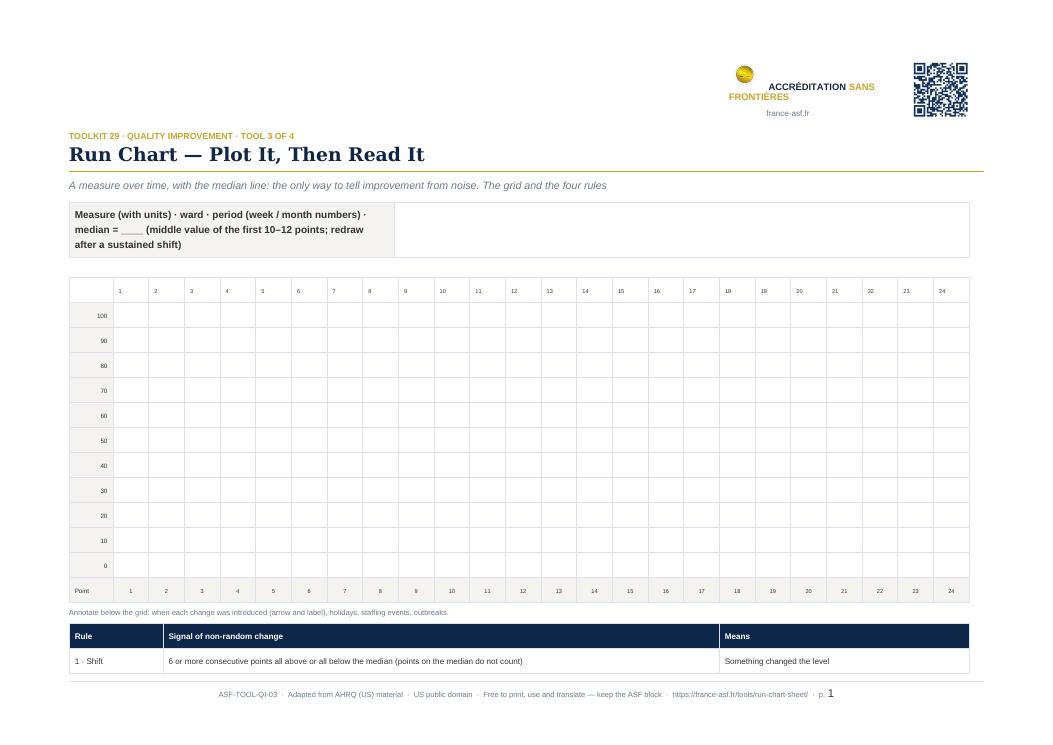
What it is
A blank run-chart grid (24 time points), the instructions (plot, draw the median, annotate changes), and the four rules for a non-random signal (shift of 6 or more on one side of the median, trend of 5 rising or falling, too few or too many runs, an astronomical point) with a worked example.
Where to use it
Every PDSA project; every dashboard in this library; the quality board on the ward wall (Tool 4). Evidence for: Governance — measurement for improvement. Evidence for: Governance — measurement for improvement.
Translate and adapt
English master edition. Georgian and other translations are added as they are clinically reviewed. Any facility may translate, add its logo and adapt wording to local practice — keeping the ASF block, the source attribution and the licence line on the sheet. Clinical thresholds and drug doses must be confirmed against national protocols before use.
The same code is printed on the tool itself. Scan it in any facility to reach this page.
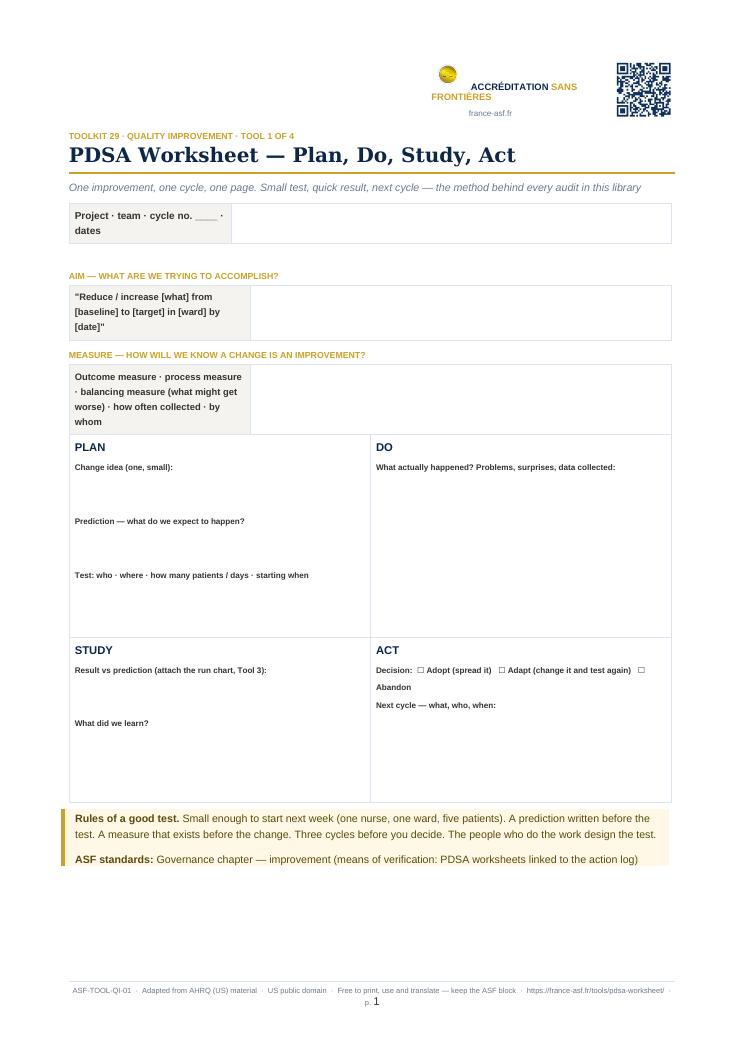 PDSA Worksheet — Plan, Do, Study, Act
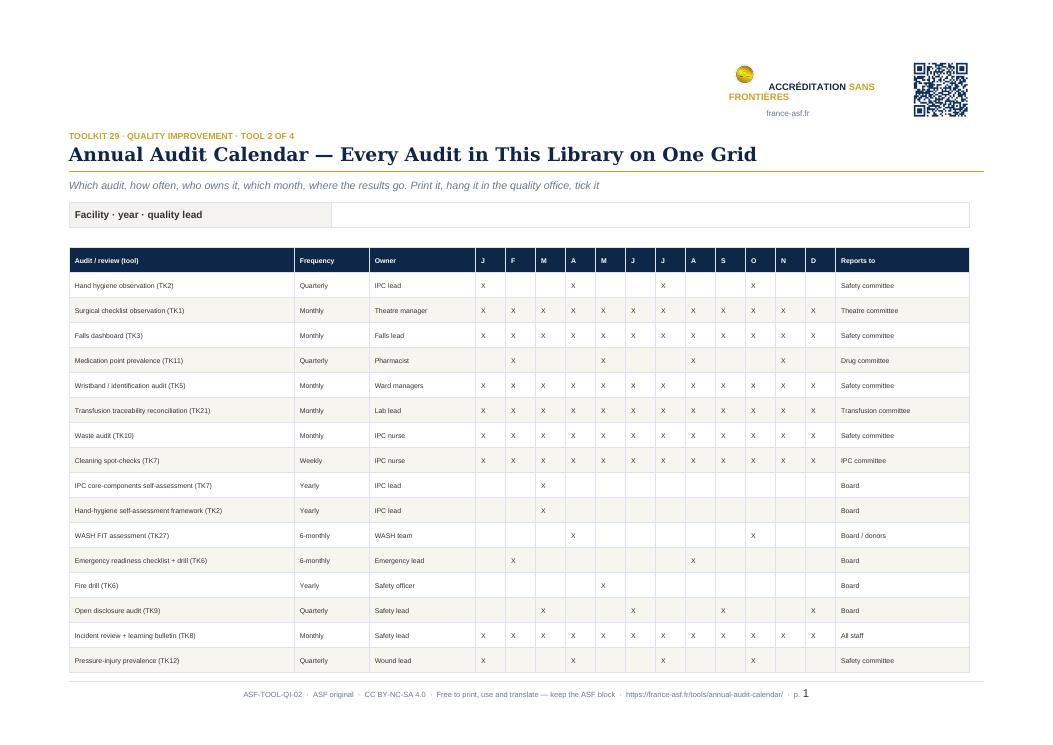 Annual Audit Calendar — Every Audit in This Library on One Grid
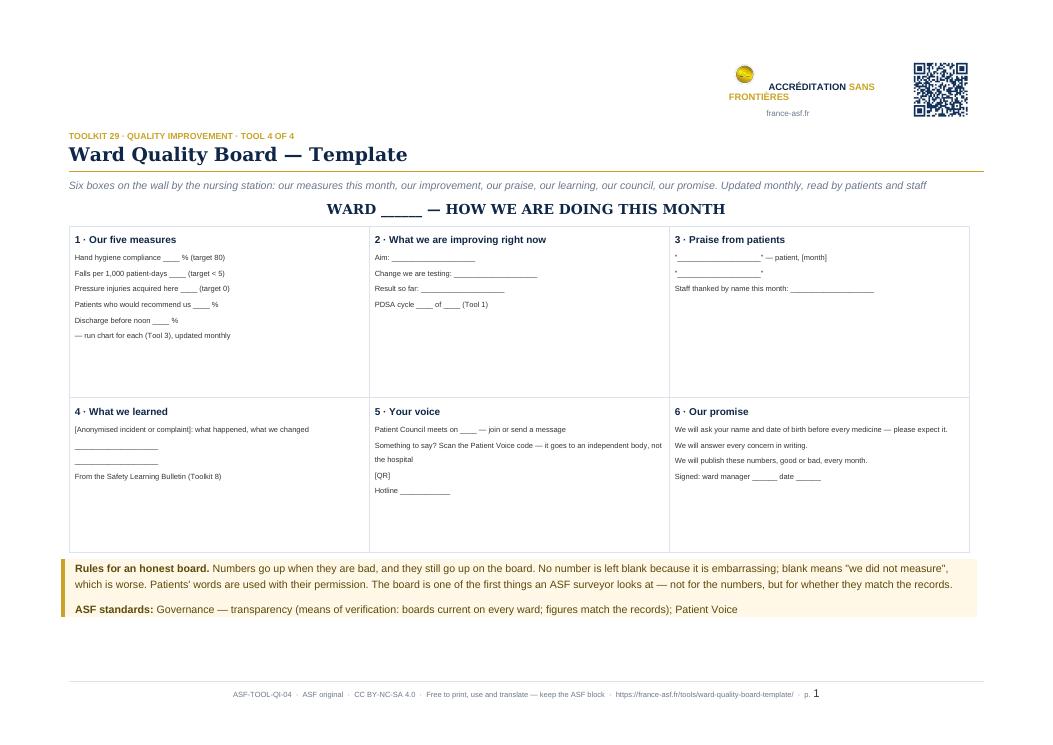 Ward Quality Board — Template
Print to share.